How unemployment has changed in South Africa over the last 20 years

South Africans consistently rank unemployment as their biggest concern.
Unemployment is the country’s most serious problem, according to responses to an Afrobarometer survey published in August. 54% of respondents aged 18 to 35, 56% of those aged 36 to 55, and 42% of those over 56 cited unemployment as the top issue.
An IPSOS poll in the first half of 2023 found that South Africa holds “the unenviable title of the world’s most worried nation on this issue”, with 69% of those questioned saying this was their “top worry”.
International comparisons are not always accurate because unemployment is not measured the same way in all countries. Nevertheless, South Africa currently has the highest unemployment rate in the world, with Djibouti and Kosovo in second place and quite far behind.
Unemployment in South Africa in 2021 was much higher than in any of the other BRICS countries, as the table below shows.
| Country | No. of people unemployed |
|---|---|
| South Africa | 35% |
| Brazil | 13% |
| India | 8% |
| Russian Federation | 5% |
| China | 4% |
Stats SA surveys people every quarter to estimate unemployment. It measures unemployment in two ways. The “official” rate includes people who:
- Did not work during the seven days prior to the survey interview;
- Want to work and are available to start work within a week of the interview; and
- Have taken active steps to look for work or to start some form of self-employment in the four weeks prior to the interview.
The unofficial or “expanded” definition of unemployment includes people who have no work but have not taken steps to look for work, either because they are discouraged or for other reasons.
Stats SA has conducted labour force surveys since 2000. We used this data in the tables and graphs below. From 2008 to 2023, we used the Q3 (July to September) quarterly survey results.
From 2000 to 2007, the surveys were not quarterly, so we used Stats SA’s September statistics. We’ve used the “official” unemployment rate throughout.
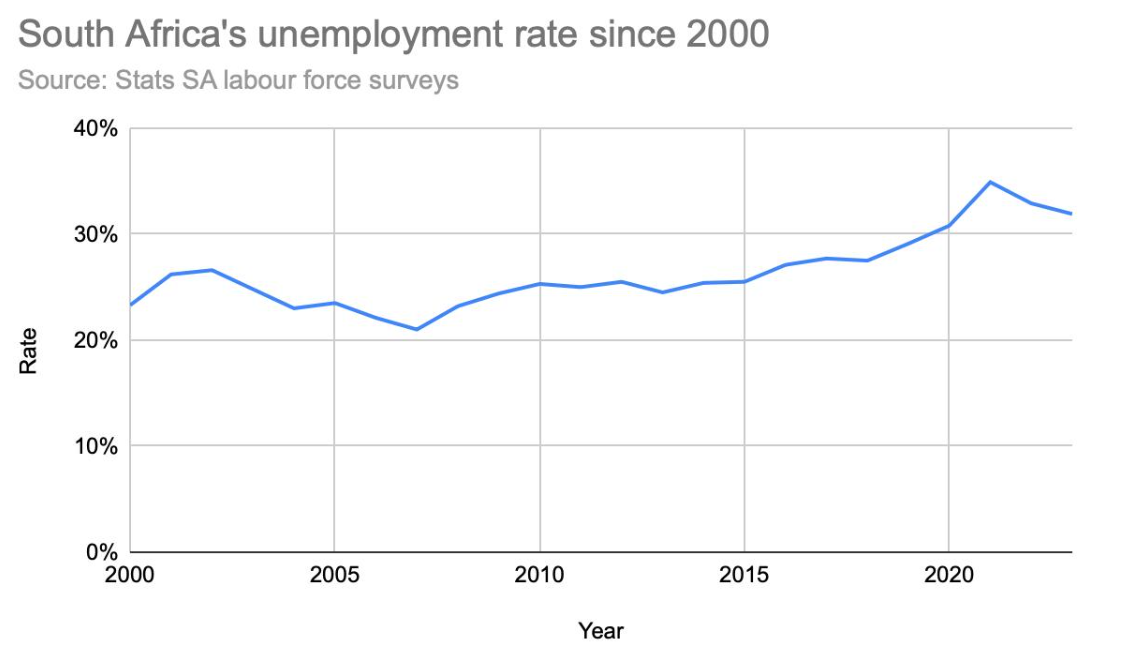
In the third quarter of 2023, the labour force consisted of 16.7 million employed people and 7.8 million unemployed people. The official unemployment rate – the percentage of people in the labour force who are unemployed – was 32%. According to the expanded definition, including discouraged work seekers, the unemployment rate was 45%.
Unemployment has not dropped below 20% since 2000.
Youth Unemployment
Youth unemployment is especially high, as this table of unemployment by age bracket shows.
| Age | No. of people unemployed (%) |
|---|---|
| 55-64 | 11 |
| 45-54 | 20 |
| 35-44 | 29 |
| 25-34 | 38 |
| 15-24 | 58 |
Youth unemployment has remained high for the past 20 years. In 2023 the unemployment rate for 15 to 24-year-olds was 58%. The highest it has been was 67% in 2021.
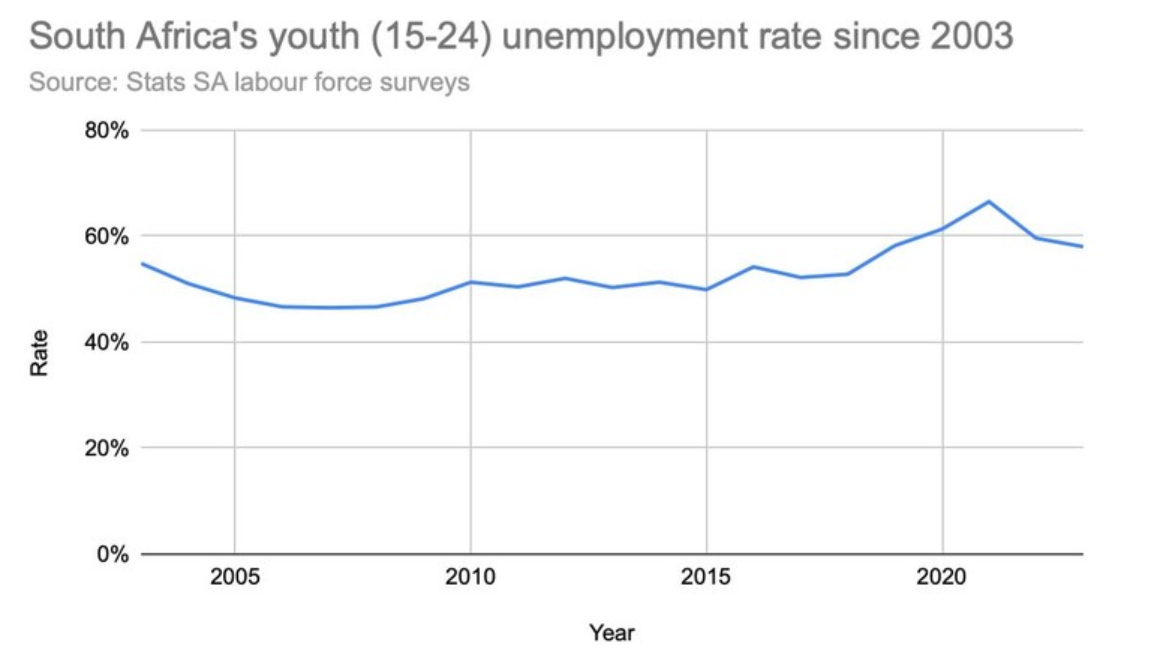
Stats SA also records the number of young people who are not employed, educated, or trained (NEET). Out of about 10.2 million people aged 15–24 years in the third quarter of this year, nearly 38% were not in employment, education or training.
Unemployment and race
Stats SA uses the apartheid race classifications to measure the extent to which racial inequality is being overcome.
In the third quarter of 2023, the official unemployment rate among Black people was 36%. Comparatively, the unemployment rate among coloured people was 22%. For Indian/Asian people, it was 12%, and for white people, it was 8%.
The table below shows 2003, 2013 and 2023 unemployment rates by race using Stats SA labour force survey data.
| 2003 (%) | 2013 (%) | 2023 (%) | |
|---|---|---|---|
| Black | 32 | 28 | 36 |
| Coloured | 24 | 24 | 22 |
| Indian/Asian | 18 | 11 | 12 |
| White | 6 | 7 | 8 |
Education and unemployment
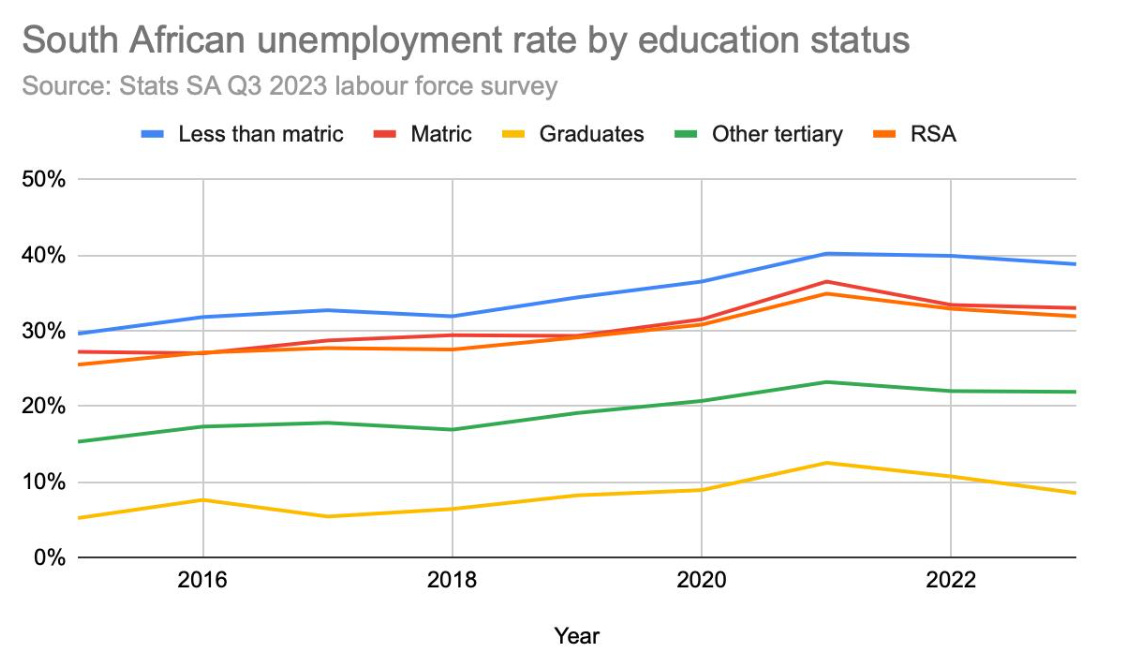
The unemployment rate is highest for people who have not completed matric and lowest for graduates. The graph below shows how the unemployment rate varies by education status. Data is from the Q3 2023 labour force survey.
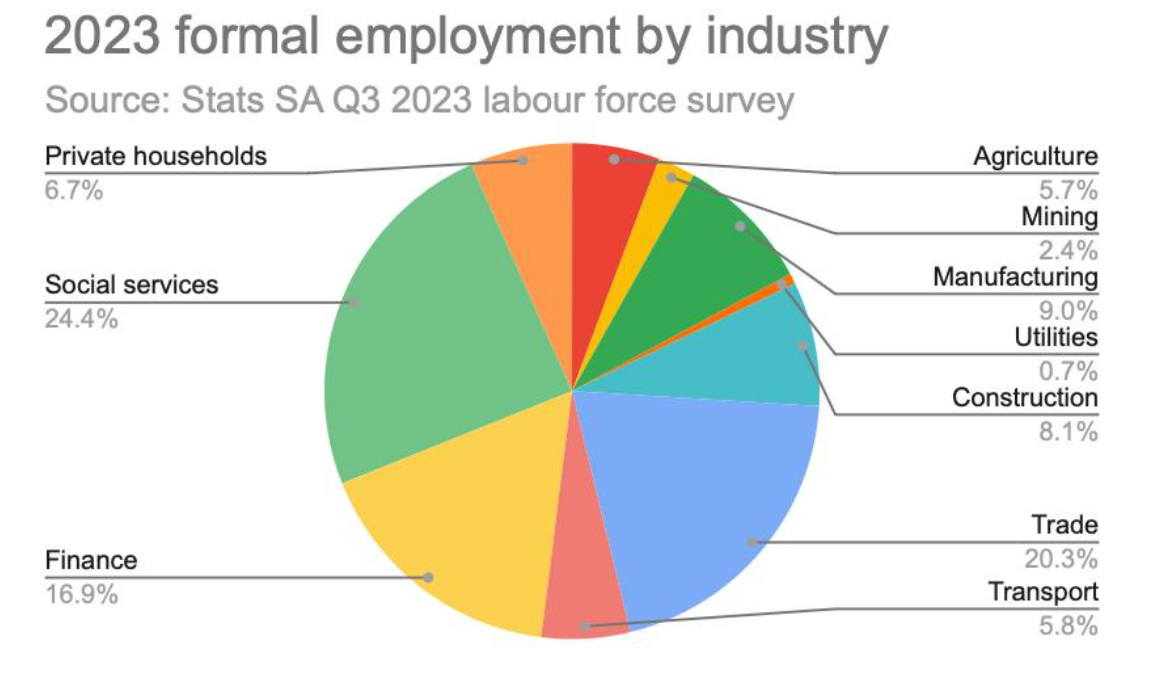
Employment by industry
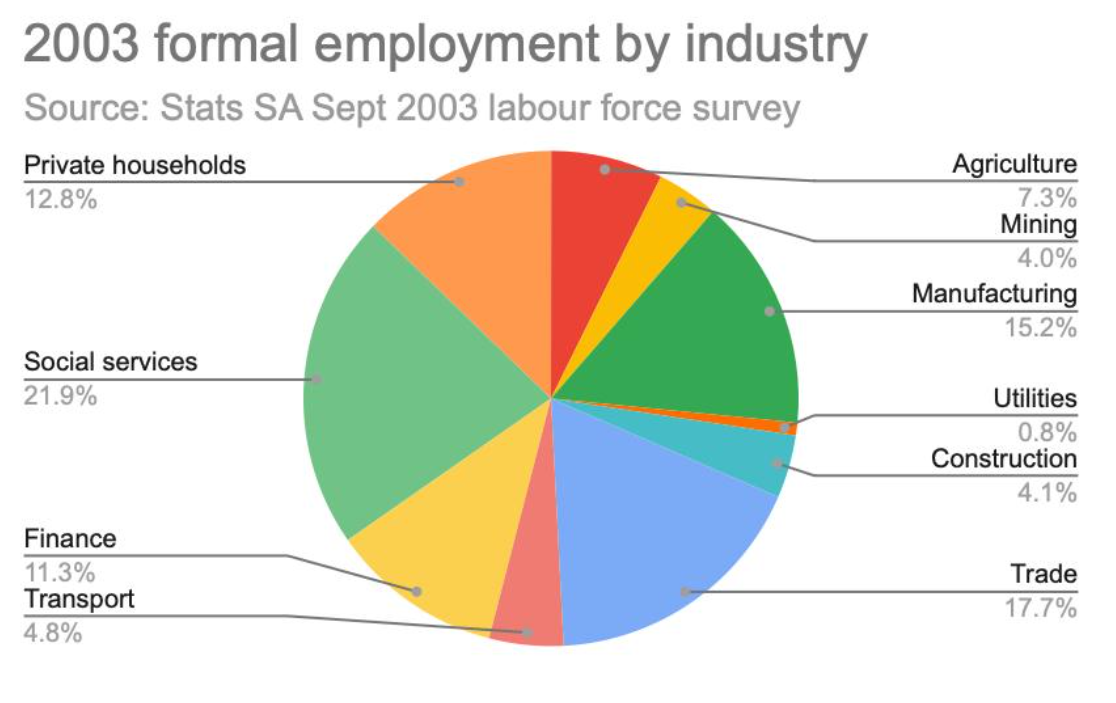
The two pie charts below, for 2003 and 2023, show how formal employment in each sector of the economy has shifted in the past 20 years, with the number of jobs in service industries like construction, finance and trade growing much faster than in traditionally important sectors like mining or construction.
| Number of employees in 2003 | Number of employees in 2023 | |
|---|---|---|
| Agriculture | 714 000 | 956 000 |
| Mining | 394 000 | 409 000 |
| Manufacturing | 1 484 000 | 1 508 000 |
| Utilities | 810 000 | 113 000 |
| Construction | 403 000 | 1 357 000 |
| Trade | 1 726 000 | 3 390 000 |
| Transport | 473 000 | 966 000 |
| Finance | 1 102 000 | 2 836 000 |
| Community and social services | 2 142 000 | 4 084 000 |
| Private households | 1 246 000 | 1 116 000 |
Read: Employees are scamming their bosses in South Africa – costing them billions